

Key Takeaways
|
If you are checking a cholesterol chart by age, you can use it to understand how your cholesterol levels compare with commonly used healthy ranges for your age group. Cholesterol levels can change as you get older, so knowing what is generally considered healthy in your 30s, 40s, 50s and beyond can make your blood test report easier to understand.
Understanding your cholesterol levels by age does not have to be complicated. Looking at your total cholesterol, LDL, HDL and triglycerides together can help you understand your results at different stages of adulthood and track how your cholesterol changes over time.
What Are Normal Cholesterol Levels by Age?
Healthy cholesterol levels can be understood using general adult reference ranges across different age groups. For most adults, total cholesterol below 200 mg/dL, LDL below 100 mg/dL, HDL of 60 mg/dL or higher and triglycerides below 150 mg/dL are commonly used reference points.
These ranges give you a useful starting point when checking your cholesterol report at different stages of life. Your age helps put the result into context, while your overall health helps determine what cholesterol level is appropriate for you. [Blumenthal et al., 2026]
For example, a 40-year-old and a 65-year-old may both have an LDL of 110 mg/dL, but their doctors may interpret the results differently based on their other health factors.
Knowing your cholesterol levels by age can help you understand your report and keep track of your heart health as you get older.
Wondering what your cholesterol levels mean for your age?
Cholesterol Levels by Age Chart for Adults
Cholesterol levels can be understood differently across age groups and between men and women. This cholesterol chart by age gives commonly used reference levels for total cholesterol, LDL, HDL and triglycerides in children, teenagers, adult men, adult women and senior citizens.
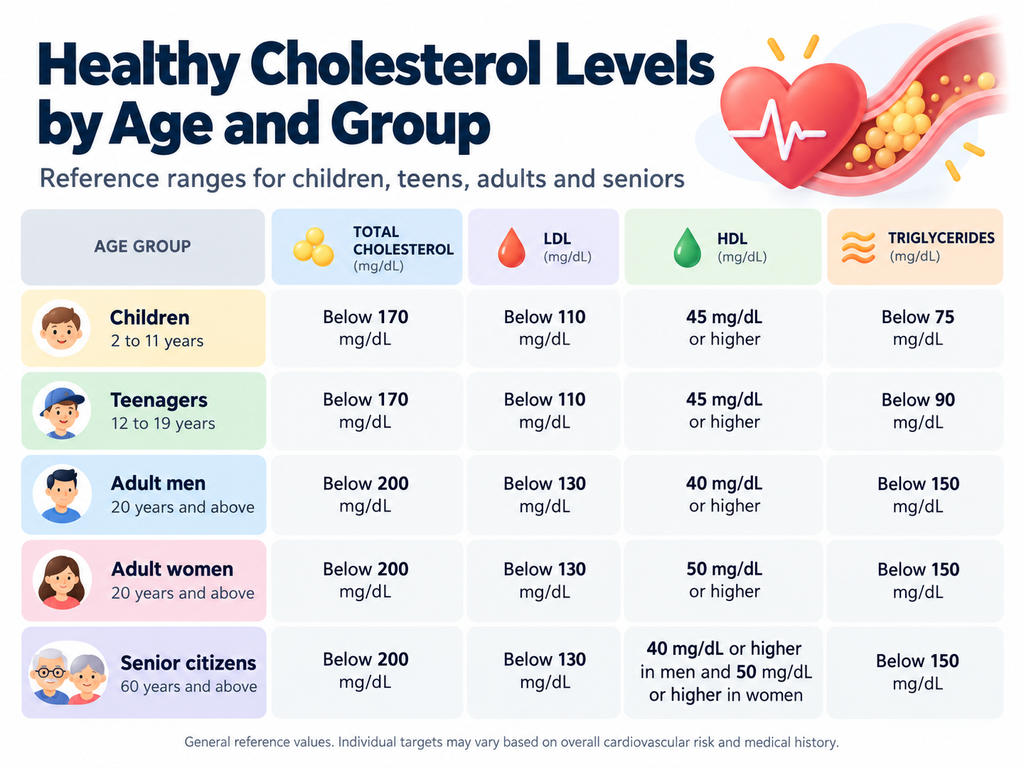
These values provide a simple reference for understanding normal cholesterol levels by age. Cholesterol levels can change as you grow older, and the healthy range can also differ between men and women. Looking at your total cholesterol, LDL, HDL and triglycerides together can give you a clearer understanding of your cholesterol report.
If you are checking your cholesterol levels by age, remember that these ranges are general reference points. Your doctor may interpret your results differently based on your health history, diabetes, blood pressure, previous heart disease and other cardiovascular risk factors.
Cholesterol Levels in Your 30s
In your 30s, a healthy cholesterol report generally means total cholesterol below 200 mg/dL, LDL below 100 mg/dL, HDL at a favourable level and triglycerides below 150 mg/dL.
This is also a useful age to pay attention to cholesterol because unhealthy levels can remain for many years before causing symptoms. Research has found that cholesterol levels can track over time, meaning a higher cholesterol level earlier in adulthood may continue to be present later in life. [Berenson et al., 1998]
Understanding your lipid profile test can help you see how LDL, HDL, triglycerides and total cholesterol fit together.
If your report shows high LDL in your 30s, it is useful to look at your diet, physical activity, weight, family history and other risk factors instead of waiting for cholesterol to become a problem later.
“Your 30s are a good time to understand your cholesterol and keep an eye on any changes. Even when you feel completely well, regular cholesterol checks can help identify changes early and give you an opportunity to work on your heart health.”
– Dr. Bipin Gond, Zonal Medical Head, Madhavbaug
Cholesterol Levels in Your 40s
In your 40s, you can use the general adult cholesterol ranges to understand your report. Total cholesterol below 200 mg/dL and LDL below 100 mg/dL are commonly used healthy reference levels, while HDL of 60 mg/dL or higher is generally considered favourable. Knowing these numbers can help you keep track of your cholesterol as you move through your 40s.
Your LDL level also needs to be understood along with your overall health. If you have diabetes, high blood pressure, smoke, have a family history of heart disease or have had a previous heart condition, your doctor may recommend a different LDL level. Knowing what LDL cholesterol means can make it easier to understand why this number matters.
The 2026 dyslipidemia guideline recommends considering your overall cardiovascular risk when deciding on an appropriate LDL goal. This means your cholesterol report can be understood more clearly when your LDL result is considered along with your other health factors.
Cholesterol Levels in Your 50s
For people in their 50s, total cholesterol under 200 mg/dL, LDL under 100 mg/dL and triglycerides under 150 mg/dL are commonly used targets when reviewing a lipid report. HDL at 60 mg/dL or above is associated with a better cardiovascular profile.
There is no fixed average cholesterol level by age for everyone in this decade. Results can shift with changes in body weight, physical activity, blood pressure, blood sugar and other aspects of ageing.
The Framingham Study observed that total cholesterol generally increased through younger and middle adulthood before decreasing in later years. HDL also showed age related changes, with patterns differing between men and women [Wilson et al., 1994].
Your 50s are therefore a useful stage to notice how your numbers are moving. Looking at earlier and newer reports together can show whether your lipid profile has remained similar or changed over the years.
Cholesterol Levels After 60
After 60, knowing your cholesterol numbers can help you understand how your heart health is changing with age. Total cholesterol below 200 mg/dL, LDL below 100 mg/dL and triglycerides below 150 mg/dL are commonly used adult ranges, while an HDL level of 60 mg/dL or higher is generally a healthy level.
Your cholesterol does not necessarily keep going up as you get older. In some older adults, total cholesterol and LDL may actually decrease with age. The Framingham study also found changes in HDL levels among older people.
One study that followed older adults over time found that total cholesterol and LDL levels could fall as age increased [Garry et al., 1992]. So, if your cholesterol report looks different after 60, it does not automatically mean that your levels should match those of someone who is younger.
After 60, your doctor can look at your cholesterol report along with relevant tests including blood pressure, blood sugar, kidney health, weight, medicines and previous heart conditions. This gives you a clearer picture of what your cholesterol numbers mean for your health at this stage of life.
| Clinical Insight “A changing cholesterol value does not have the same meaning at every age. For example, an increase in LDL during early or middle adulthood may warrant closer attention to cardiovascular risk factors, while a fall in cholesterol in later life needs to be interpreted in the context of the person’s overall health, medicines and nutritional status. Looking at the direction of change alongside the patient’s clinical picture is more informative than judging a single cholesterol value in isolation.” Dr. Pravin Jayram Ghadigaonkar, BAMS, MD, PhD (Scholar) – Preventive Cardiology 20+ Years of Clinical Experience, Head Medical Operations & Patient Improvement, Madhavbaug |
Does Cholesterol Naturally Increase With Age?
Cholesterol can change with age, but it does not simply increase every year. Cholesterol patterns can differ by age, sex, weight, lifestyle and other health factors.
Research has found that total cholesterol may rise through early and middle adulthood, while some studies have observed a decline in older age. Changes in body weight can also influence cholesterol levels. [Wilson et al., 1994]
A study also found differences in cholesterol patterns between men and women and changes in lipid levels over a seven-year period. [Bansal et al., 2016]
This is why your latest report is useful, but comparing it with previous reports can provide even more information about your cholesterol pattern.
When Should You Be Concerned About Your Cholesterol?
A cholesterol result deserves medical attention when LDL, total cholesterol or triglycerides are above the desired range, HDL is low or several risk factors are present together.
You should discuss your cholesterol report with a doctor if you have:
- High LDL cholesterol
- Low HDL cholesterol
- High triglycerides
- Diabetes
- High blood pressure
- Kidney disease
- A family history of high cholesterol or early heart disease
- Previous heart attack, stroke or other cardiovascular disease
Very high LDL levels also need particular attention. The current dyslipidemia guideline considers LDL of 190 mg/dL or higher as severe hypercholesterolaemia, for which treatment is recommended regardless of estimated 10-year cardiovascular risk.
If you are unsure how to read your report, understanding your cholesterol report can help you see how total cholesterol, LDL and HDL are different.
Understanding Your Cholesterol Levels at Madhavbaug
At Madhavbaug, the focus is on understanding why your cholesterol levels may have changed and what other aspects of your health may be influencing them.
Our doctors may also consider blood pressure, blood sugar, weight, current medicines, lifestyle and relevant health history. Previous cholesterol reports can be compared with your current results to understand whether your lipid levels are improving or changing over time.
The treatment programme at Madhavbaug may include Ayurvedic medicines, Panchakarma therapies, dietary support and lifestyle guidance selected according to your individual needs. The approach is focused on supporting healthy cholesterol levels while also addressing factors such as digestion, weight, blood sugar and blood pressure that can influence overall cardiovascular health.
If you want to understand your cholesterol levels by age and what your latest report means for your heart health, visit your nearest Madhavbaug centre and discuss your results with a doctor.
Want to understand your cholesterol levels better?
Frequently Asked Questions
What is a normal cholesterol level by age?
For most adults, total cholesterol below 200 mg/dL and LDL below 100 mg/dL are commonly used desirable reference levels. HDL of 60 mg/dL or higher is considered favourable, while triglycerides below 150 mg/dL are generally considered normal.
Does cholesterol increase with age?
Cholesterol can change with age, but it does not simply increase every year. Levels can be influenced by body weight, diet, physical activity, sex and other health factors.
What is a normal cholesterol level for a 50 year old?
A 50-year-old adult generally uses the same broad adult reference levels, such as total cholesterol below 200 mg/dL and LDL below 100 mg/dL. The right LDL goal may be lower depending on cardiovascular risk.
What is a healthy LDL level after 60?
An LDL below 100 mg/dL is a commonly used healthy reference level, but the appropriate LDL goal after 60 depends on overall cardiovascular risk and existing health conditions.
What is a good HDL level by age?
An HDL level of 60 mg/dL or higher is generally considered favourable in adults. HDL below 40 mg/dL in men and below 50 mg/dL in women is generally considered low.
Can cholesterol be high without symptoms?
Yes. High cholesterol usually does not cause noticeable symptoms. A blood test is needed to measure total cholesterol, LDL, HDL and triglycerides.
References
Bansal, S. et al. (2016) ‘Gender differences in 7 years trends in cholesterol lipoproteins and lipids in India: Insights from a hospital database’, Indian Heart Journal, 68(4), pp. 470–476.
Blumenthal, R.S. et al. (2026) ‘2026 ACC/AHA/AACVPR/ABC/ACPM/ADA/AGS/APhA/ASPC/NLA/PCNA Guideline on the Management of Dyslipidemia’, Circulation.
Garry, P.J., Hunt, W.C., Koehler, K.M., VanderJagt, D.J. and Vellas, B.J. (1992) ‘Longitudinal study of dietary intakes and plasma lipids in healthy elderly men and women’, American Journal of Clinical Nutrition, 55(3), pp. 682–688.
Wilson, P.W.F., Anderson, K.M., Harris, T., Kannel, W.B. and Castelli, W.P. (1994) ‘Determinants of change in total cholesterol and HDL-C with age: the Framingham Study’, Journal of Gerontology, 49(6), pp. M252–M257.





 Locate a Centre

